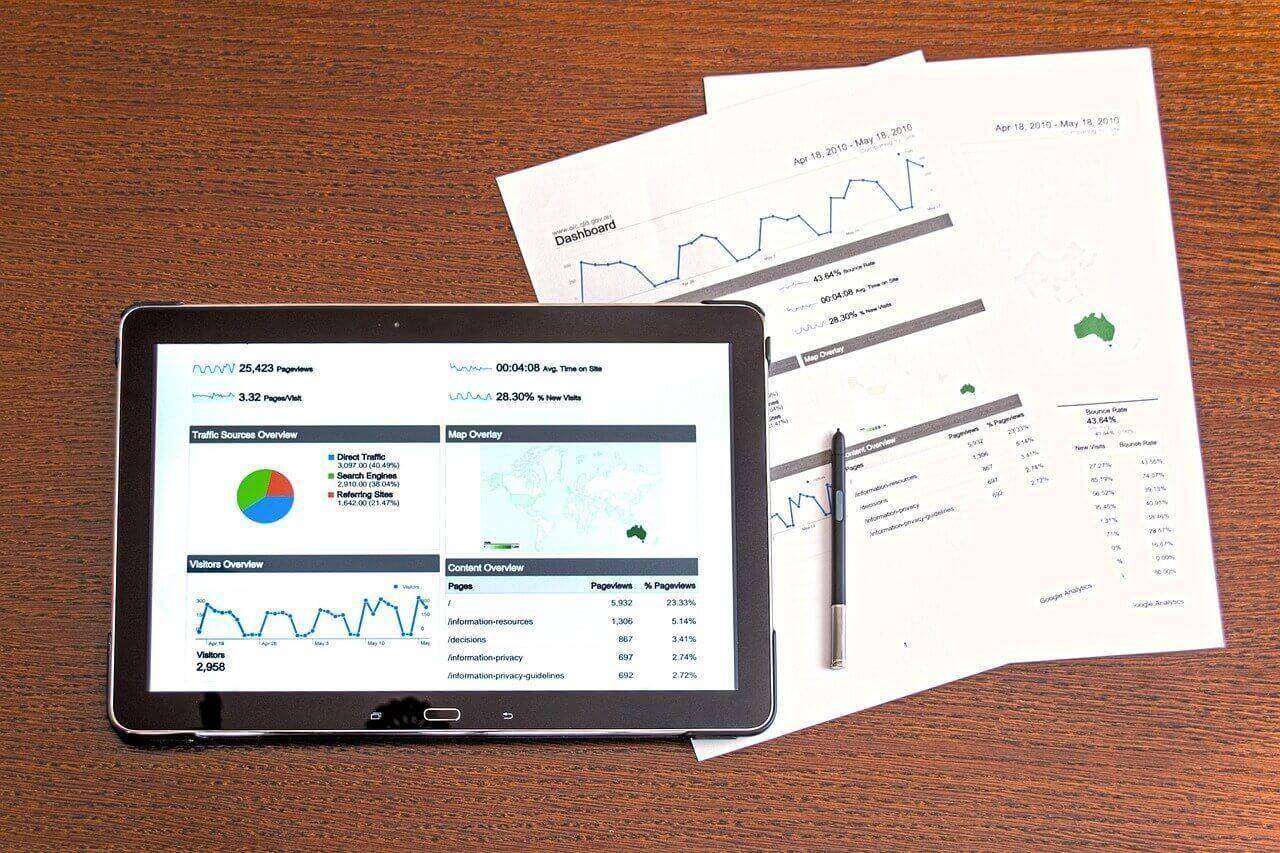
The Commerce Department monthly retail sales series lands as a single number, but operators treat it as a set of category signals that arrive on a fixed calendar. Because the report is published weeks before most internal reconciliation closes, it frequently becomes the first independent check on whether a category plan is holding. The discipline that matters is not reading the headline, but deciding which categories to re-plan and by how much before the next buying window closes.
Key Conclusions
Category-level revisions are where the operational value sits. A headline that meets expectations can still hide wide dispersion, with one category running several points above plan and another several points below. When that dispersion is not separated, replenishment orders get adjusted on the basis of an average that no store actually experiences. Splitting the print by category and by channel is the minimum step required before any order changes.
The second consideration is timing relative to the buying calendar. Replenishment decisions made after a print is published but before allocation windows close can still affect in-season availability. Decisions made after those windows close only affect markdown and next-season plans. Mapping each category to its allocation window turns a monthly report into an actionable schedule rather than a retrospective commentary.
Reading the Print: Signals and Noise
Separating level from momentum
A single monthly figure mixes level and momentum. Level tells you where demand sits relative to last year, while momentum tells you whether the recent direction is improving or deteriorating. Two categories can show identical year-over-year levels while moving in opposite directions. Plotting a three-month rolling change alongside the year-over-year level is a low-cost way to keep those two readings separate and avoid overreacting to one month.
Why the revision history matters
Monthly retail data is revised, sometimes materially, as more complete responses arrive. Operators who treat the first print as final can end up re-planning a category on the basis of a number that later moves. Keeping the previous three prints side by side makes revision patterns visible, and those patterns often reveal which categories have thinner reporting samples and therefore deserve more caution before allocation changes.
Best Practices
Tie every category to an allocation window
The practical fix is a simple table that maps each category to the last date on which an order change can still affect in-season supply. Once that table exists, the monthly print generates a short list of decisions that are still actionable, and everything else is routed to planning rather than buying. This prevents the common failure mode where urgent-looking analysis consumes attention but produces no executable change.
Set thresholds before the print lands
Pre-committing to thresholds removes discretion from the review meeting. A workable convention is to re-plan a category only when it deviates from plan by more than two points for two consecutive months, or by more than four points in a single month. Thresholds set in advance also make it easier to explain to merchandising why a visible category was left untouched despite an attention-grabbing headline.
Common Mistakes
The first mistake is reacting to the headline before decomposing it. Aggregate retail sales can rise while a specific category falls, and adjusting inventory on the aggregate signal pushes stock in the wrong direction. A second mistake is ignoring channel mix. A category can be flat overall while shifting sharply between online and store, which has very different implications for allocation depth and pack configuration.
A third mistake is treating the report as a forecast. Monthly retail data describes what already happened, and using it as a forward indicator without accounting for the publication lag leads to late responses. A fourth mistake is failing to archive each print. Without a stored history, revision patterns and seasonal distortions become invisible, and the same misinterpretation repeats every year.
Operating Model: From Print to Purchase Order
A workable operating model runs in five steps within a fixed window. Decompose the print by category and channel on day one. Compare each category against the pre-committed thresholds on day two. Map deviations to allocation windows to identify what is still actionable. Route actionable items to buying with a required depth change, and route the remainder to planning with a note. Close the loop by recording which changes were made and reviewing outcomes against the next print.
The value of the loop is cumulative. After three or four cycles, the team can measure how often a threshold breach actually led to a correct adjustment, which turns the threshold values themselves into a tunable parameter rather than a fixed rule. Rail and parcel reliability data plays a similar role on the supply side, where consistent measurement over time is what makes short-term signals trustworthy enough to act on.
Summary
The monthly retail sales report is most useful as a decomposition exercise rather than a headline event. Its value comes from separating level from momentum, breaking the aggregate into categories and channels, and mapping each deviation to the window in which a decision can still change in-season availability.
The four operating requirements are a category-to-window map, pre-committed thresholds, a stored print history, and a recorded decision log. Together they convert a recurring data release into a repeatable process, which is the difference between reading the news and running a replenishment system.
Data Sources
- Retail Dive: monthly retail sales series
- Retail Dive: apparel outlook and tariff refunds
- Supply Chain Dive: consumer electronics supply chain trends
- Supply Chain Dive: rail speed and dwell metrics
- Supply Chain Dive: filing deadlines for low-cost imports
FAQ
Why decompose the monthly print by category?
A: A headline that meets expectations can still hide wide dispersion, and adjusting replenishment on an average no store experiences pushes stock the wrong way.
What is the difference between level and momentum?
A: Level shows where demand sits versus last year, momentum shows whether the recent direction is improving. Two categories can share a level while moving oppositely.
Why keep previous prints?
A: Monthly data is revised. Storing three prints makes revision patterns visible and flags categories with thinner reporting samples.
What is a category-to-window map?
A: A table linking each category to the last date on which an order change still affects in-season supply, so only actionable items reach buying.
How should thresholds be set?
A: In advance. A common convention is re-planning after a two-point deviation for two consecutive months, or a four-point deviation in a single month.
What is the main risk of treating the report as a forecast?
A: It describes what already happened. Ignoring the publication lag produces late responses that miss the relevant allocation window.