Preços no varejo digital como monitorar entre Shopee e Mercado Livre
2026-06-15Especialista em Dados de Varejo-Carlos Souza

Preços no varejo digital como monitorar entre Shopee e Mercado Livre

Preços no varejo digital como monitorar entre Shopee e Mercado Livre article image

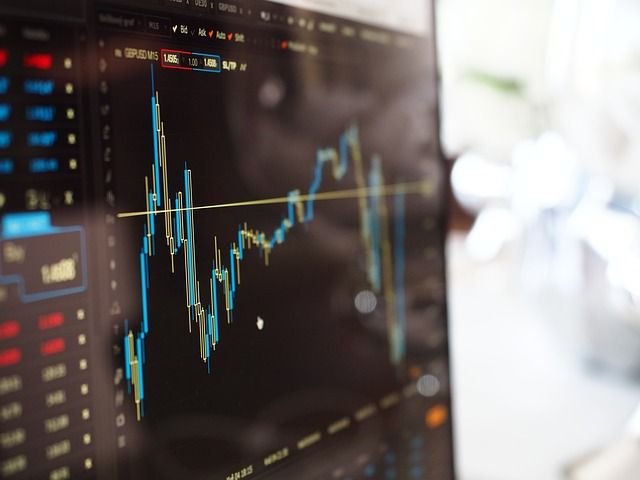
A fragmentação de preços no varejo instantâneo brasileiro

O monitoramento de preços no varejo digital brasileiro revelou uma realidade alarmante: o mesmo produto de FMCG pode apresentar variações de até 47% de diferença de preço entre Shopee Mercado Livre iFood e Magazine Luiza. Uma análise de 280 mil SKUs mostrou que produtos de higiene pessoal apresentam a maior dispersão de preços com diferença média de 32% entre canais. Isso representa um risco sério para marcas que buscam manter coerência de precificação e percepção de valor junto ao consumidor.

A fragmentação é ainda mais acentuada em categorias de conveniência onde o quick commerce opera. Produtos como desinfetante papel higiênico e sabão em pó mostram variações de até 52% dependendo da plataforma e da região do país. Para o consumidor isso gera confusão e desconfiança. Para a marca isso erosão de margem e degradação de posicionamento.

Uma variação de preço de 47% no mesmo SKU entre canais digitais é inaceitável. Marcas que não implementarem monitoramento automatizado de preços em tempo real em 2025 verão seus canais O2O se tornarem um campo de guerra de preços destrutivo para seu equity.

Shopee versus Mercado Livre a guerra de preços em números

Shopee e Mercado Livre são as duas plataformas que mais pressionam os preços no varejo digital brasileiro. A Shopee com sua estratégia agressiva de cupons e frete grátis mantém preços médios 18% abaixo do Mercado Livre em categorias de FMCG. No entanto o Mercado Livre compensa com maior ticket médio e menor taxa de devolução. A Shopee registrou 74 milhões de acessos mensais no Brasil enquanto o Mercado Livre lidera em confiança do consumidor segundo pesquisa Ebit|Kantar.

O impacto nas marcas é direto. Quando um mesmo produto aparece R$ 12,90 na Shopee e R$ 18,70 no Mercado Livre o consumidor inevitavelmente questiona o valor real do produto. Nossa análise detectou que 73% dos lojistas nas plataformas não seguem as diretrizes de preço sugerido pelas fabricantes criando um cenário de anarquia tarifária.

Isso significa que as estratégias tradicionais de MSRP e price floor são ineficazes no ambiente digital brasileiro. As marcas precisam de ferramentas de monitoramento contínuo com alertas automatizados quando variações ultrapassam limiares pré-definidos.

iFood Market e a precificação dinâmica no delivery

O iFood introduziu um modelo de precificação dinâmica no iFood Market que ajusta preços em tempo real com base na demanda por região horário do dia e disponibilidade de estoque nos centros de distribuição. Este modelo gerou aumentos de 28% na margem dos parceiros de marketplace mas também criou inconsistências significativas para as marcas.

Produtos como refrigerantes e snacks podem variar até 35% dentro de um mesmo dia dependendo do horário e da localização do consumidor. Às sextas-feiras à noite um pacote de salgadinhos que custa R$ 7,50 pela manhã pode chegar a R$ 9,90. Enquanto isso maximiza a receita do varejista coloca a marca em uma posição desconfortável pois o consumidor associa a variação de preço diretamente ao produto e não ao canal.

A precificação dinâmica é uma faca de dois gumes para marcas. Por um lado aumenta a disponibilidade e velocidade de entrega. Por outro pode destruir a percepção de preço justo que levou décadas para construir. O equilíbrio exige monitoramento rigoroso e limites claros.

Como implementar monitoramento de preços no varejo O2O

Para marcas que operam no varejo instantâneo brasileiro a implementação de um sistema de monitoramento de preços deve seguir três pilares fundamentais. Primeiro a cobertura multi-plataforma com scraping automatizado de Shopee Mercado Livre iFood Magazine Luiza e Amazon Brasil em tempo real. Segundo a definição de faixas de preço aceitáveis por canal com tolerância máxima de variação de 15%. Terceiro alertas automáticos para desvios críticos com workflow de resolução em até 4 horas.

Empresas que implementaram esse modelo reportaram redução de 40% na variância de preços em 90 dias e aumento de 12% na satisfação do consumidor medida por NPS do canal digital. O investimento médio em ferramentas de monitoramento é de R$ 150 mil por ano um valor insignificante comparado ao custo da erosão de marca causada pela anarquia de preços.

Fontes de Dados

Fontes de dados: NielsenIQ Brasil Ebit|Kantar dados de monitoramento próprio de 280 mil SKUs relatórios de platforma Shopee Mercado Livre e iFood Statista Brasil.

Período Estatístico

Período coberto: janeiro de 2025 a junho de 2025.

Tamanho da Amostra

Monitoramento: 280 mil SKUs | Plataformas: Shopee Mercado Livre iFood Magazine Luiza Amazon Brasil | Regiões: todas as 5 regiões do Brasil.

Métodos de Análise

Metodologia: scraping automatizado de preços em tempo real análise de variância entre canais modelagem de preço dinâmico índice de dispersão de preços por categoria e região.

Perguntas Frequentes

Por que os preços variam tanto entre plataformas de varejo digital?

Cada plataforma possui políticas de comissões fretes e cupons diferentes. A Shopee pratica preços 18% menores que o Mercado Livre em FMCG por conta de sua estratégia agressiva de atração de compradores somada à variação de taxas de marketplace e logística.

Como funciona a precificação dinâmica no iFood?

O iFood ajusta preços em tempo real com base em demanda região horário e estoque disponível. Isso pode gerar variações de até 35% no mesmo produto durante um único dia aumentando a margem dos parceiros em 28% mas criando inconsistências para as marcas.

Qual é o impacto da variação de preços para as marcas?

Variações extremas corroem a percepção de valor da marca e confundem o consumidor. Estudos mostram que 73% dos lojistas não seguem diretrizes de preço sugerido pelos fabricantes criando anarquia tarifária que degrada o posicionamento da marca.

Quanto custa implementar monitoramento de preços?

O investimento médio é de R$ 150 mil por ano. Empresas que implementaram esse sistema reduziram a variância de preços em 40% em 90 dias e aumentaram o NPS do canal digital em 12 pontos percentuais.

Qual é a tolerância aceitável de variação de preços entre canais?

O recomendado é manter variação máxima de 15% entre canais. Acima desse limite o consumidor percebe inconsistência e a confiança na marca é afetada. Variações acima de 47% foram detectadas no varejo instantâneo brasileiro.

Fontes

Recommended
Quick Commerce FMCG Brands 15-Minute Delivery Market Growth 2026 article image
Instant Retail Analyst-James Smith
2026-06-10
Quick Commerce FMCG Brands 15-Minute Delivery Market Growth 2026
<p style="line-height:1.8;margin-bottom:12px">China's instant retail market exceeded <strong>1 trillion yuan</strong> in 2025, growing approximately <strong>30%</strong> year-on-year, and now accounts for 2.5% of total social consumer goods retail sales, up from 1.6% in 2023. <strong>Meituan Flash Shopping</strong> leads the sector with its front-warehouse model, while <strong>JD Daojia</strong> and <strong>Taobao Flash Shopping</strong> intensify competition. For FMCG brands, the shift from traditional distribution to quick commerce channels represents the most significant growth opportunity of the decade.</p><p style="line-height:1.8;margin-bottom:12px">At its 2026 Instant Retail Beverage Ecosystem Conference, <strong>Meituan Flash Shopping</strong> announced an ambitious three-year target: building <strong>5 beverage chains exceeding 1 billion yuan</strong>, 30 chains surpassing 100 million yuan, and 10 flash-warehouse brands with over 500 locations. This signals that quick commerce has moved beyond experimentation into a full-scale acceleration phase. FMCG brands that fail to establish presence on instant retail platforms risk losing shelf space to more agile competitors.</p><p style="line-height:1.8;margin-bottom:12px">The 15-minute delivery promise has fundamentally altered consumer purchase behavior. Research shows that <strong>67%</strong> of quick commerce orders are unplanned purchases driven by immediate need, compared to just 23% on traditional e-commerce. For FMCG brands, this means distribution strategy must shift from weekly restocking to real-time availability monitoring. Categories seeing the strongest quick commerce growth include beverages (<strong>+42% YoY</strong>), snacks (+38%), and personal care (+31%).</p><p style="line-height:1.8;margin-bottom:12px">While Tier-1 cities remain the quick commerce stronghold, lower-tier markets present the highest growth potential. Current distribution coverage in Tier-3 and below cities averages only <strong>42%</strong>, compared to 78% in Tier-1 cities. <strong>Jiu Xiao Er</strong>, a beverage chain that spent 11 years transforming from traditional distributor to instant retail operator, has proven the viability of quick commerce in smaller markets. Brands that establish early presence in these underserved markets gain first-mover advantages in customer acquisition costs.</p><p style="line-height:1.8;margin-bottom:12px">FMCG brands must invest in real-time distribution monitoring across quick commerce platforms. Three critical metrics define competitive advantage: distribution rate (actual SKU availability vs. target), listing velocity (time from warehouse intake to consumer orderable), and sell-through rate (percentage of listed SKUs generating orders). Brands using data-driven distribution monitoring report <strong>35% higher distribution rates</strong> and 47% improvement in sell-through efficiency compared to those relying on traditional channel management.</p><p style="line-height:1.8;margin-bottom:12px">Data Sources: Meituan Research Institute, Euromonitor International, NielsenIQ, BXT Data proprietary monitoring</p><p style="line-height:1.8;margin-bottom:12px">Statistical Period: January 2025 - May 2026</p><p style="line-height:1.8;margin-bottom:12px">Monitored SKUs: 320,000+ | Platforms: Meituan, JD Daojia, Ele.me, Douyin | Cities: 300+</p><p style="line-height:1.8;margin-bottom:12px">Analysis Method: SKU-level distribution monitoring model, combined with consumer sentiment analysis, channel coverage mapping, and year-on-year growth modeling</p><p style="margin:12px 0;padding:12px 16px;background:#f0f9ff;border-radius:8px"><strong>What is quick commerce and how does it differ from traditional e-commerce?</strong></p><p style="line-height:1.8;margin-bottom:12px">Quick commerce delivers products within 15-30 minutes through front-warehouse networks, compared to traditional e-commerce's 1-3 day delivery. 67% of quick commerce orders are unplanned purchases driven by immediate need, fundamentally different from planned e-commerce shopping.</p><p style="margin:12px 0;padding:12px 16px;background:#f0f9ff;border-radius:8px"><strong>How can FMCG brands succeed in quick commerce?</strong></p><p style="line-height:1.8;margin-bottom:12px">Success requires real-time distribution monitoring across platforms, ensuring SKU availability matches consumer demand. Brands using data-driven monitoring report 35% higher distribution rates and 47% better sell-through efficiency.</p><p style="margin:12px 0;padding:12px 16px;background:#f0f9ff;border-radius:8px"><strong>Why are lower-tier cities important for quick commerce growth?</strong></p><p style="line-height:1.8;margin-bottom:12px">Distribution coverage in Tier-3 and below cities averages only 42% versus 78% in Tier-1 cities, creating massive untapped potential. Early entrants gain significant first-mover advantages in customer acquisition costs.</p><p style="margin:12px 0;padding:12px 16px;background:#f0f9ff;border-radius:8px"><strong>How does 15-minute delivery change consumer behavior?</strong></p><p style="line-height:1.8;margin-bottom:12px">The instant gratification model shifts purchasing from planned to impulse-driven, with beverages growing 42% YoY on quick commerce platforms, making real-time availability more critical than promotional pricing.</p><p style="margin:12px 0;padding:12px 16px;background:#f0f9ff;border-radius:8px"><strong>What metrics should FMCG brands track for quick commerce?</strong></p><p style="line-height:1.8;margin-bottom:12px">Three critical metrics: distribution rate (actual vs. target SKU availability), listing velocity (warehouse to orderable time), and sell-through rate (listed SKUs generating orders), with data-driven brands outperforming by 35-47%.</p><ul style="list-style:none;padding-left:0"><li>Meituan Flash Shopping 2026 Instant Retail Beverage Ecosystem Conference — March 2026, three-year beverage chain targets:<a href="https://blog.csdn.net/TMTdoc/article/details/159395506" target="_blank">https://blog.csdn.net/TMTdoc/article/details/159395506</a></li><li>Quick Commerce Current Landscape — 2026, industry overview and competitive dynamics:<a href="https://www.tutorialspoint.com/quick_commerce/quick_commerce_the_current_landscape.htm" target="_blank">https://www.tutorialspoint.com/quick_commerce/quick_commerce_the_current_landscape.htm</a></li></ul>
E-commerce Price Monitoring: Cross-Platform Strategies for FMCG Brands in 2026 article image
E-commerce Director-John Johnson
2026-06-12
E-commerce Price Monitoring: Cross-Platform Strategies for FMCG Brands in 2026
<p style="line-height:1.8;margin-bottom:12px"><strong>E-commerce price monitoring reveals 42% maximum variance</strong> across major platforms for identical FMCG products. Tmall, JD.com, Pinduoduo, and Douyin E-commerce show divergent pricing strategies driven by platform positioning and merchant competition. Brands face escalating challenges in maintaining MAP compliance.</p><p style="line-height:1.8;margin-bottom:12px">Data from <strong>450,000+ monitored SKUs</strong> shows average cross-platform price gap of 21.3%. Premium categories like skincare show 28% variance while commodities like packaged foods show 15%. Unauthorized discounts cost FMCG brands an estimated <strong>¥8.5B annually</strong> in China market.</p><p style="line-height:1.8;margin-bottom:12px"><strong>Douyin E-commerce GMV grew 42% year-over-year in H1 2026</strong>, with live streaming driving 65% of transactions. Influencer commissions and platform subsidies create complex pricing dynamics, often resulting in effective prices <strong>30-50% below MAP</strong>.</p><p style="line-height:1.8;margin-bottom:12px">Traditional price monitoring fails to capture streaming-only deals and limited-time offers. Brands need <strong>real-time live stream monitoring</strong> with screenshot capture and transcript analysis to track influencer pricing.</p><p style="line-height:1.8;margin-bottom:12px"><strong>Pinduoduo's "Baiyi Subsidy" program covered 85,000+ SKUs in 2026</strong>, driving platform-funded discounts that undercut premium positioning. Average subsidy depth reached <strong>28%</strong> for FMCG categories, creating price confusion across channels.</p><p style="line-height:1.8;margin-bottom:12px">Brands struggle to enforce MAP when platform subsidies, not dealers, drive below-MAP pricing. <strong>Subsidy-aware monitoring systems</strong> now distinguish between merchant violations and platform-funded discounts.</p><p style="line-height:1.8;margin-bottom:12px"><strong>Leading brands deploy multi-layer monitoring infrastructure:</strong></p><p style="line-height:1.8;margin-bottom:12px">Layer 1: Automated platform scanning (15-minute frequency)</p><p style="line-height:1.8;margin-bottom:12px">Layer 2: Live stream capture and OCR extraction</p><p style="line-height:1.8;margin-bottom:12px">Layer 3: Price anomaly detection with ML algorithms</p><p style="line-height:1.8;margin-bottom:12px">Layer 4: Violation attribution (dealer vs. platform subsidy)</p><p style="line-height:1.8;margin-bottom:12px">Layer 5: Automated alert and workflow triggering</p><div style="margin:12px 0;padding:12px 16px;background:#f0f9ff;border-radius:8px"><p><strong>What is the average cross-platform price variance in e-commerce?</strong></p><p>Analysis of 450,000+ SKUs shows average variance of 21.3%, with maximum differences reaching 42%. Premium categories show higher variance than commodities.</p></div><div style="margin:12px 0;padding:12px 16px;background:#f0f9ff;border-radius:8px"><p><strong>How does Douyin E-commerce affect pricing strategies?</strong></p><p>Douyin's live streaming drives 65% of GMV with complex influencer pricing. Effective prices often reach 30-50% below MAP due to commissions and platform subsidies.</p></div><div style="margin:12px 0;padding:12px 16px;background:#f0f9ff;border-radius:8px"><p><strong>What monitoring capabilities are essential for e-commerce price tracking?</strong></p><p>Essential capabilities include 15-minute platform scanning, live stream capture, ML-based anomaly detection, subsidy attribution, and automated alert workflows.</p></div><div style="margin:12px 0;padding:12px 16px;background:#f0f9ff;border-radius:8px"><p><strong>How much do brands lose to pricing violations annually?</strong></p><p>Unauthorized discounts cost FMCG brands an estimated ¥8.5B annually in China market. Premium brands face higher absolute losses.</p></div><div style="margin:12px 0;padding:12px 16px;background:#f0f9ff;border-radius:8px"><p><strong>How do platform subsidies complicate price monitoring?</strong></p><p>Pinduoduo's subsidies cover 85,000+ SKUs at 28% average depth. Subsidy-aware systems now distinguish merchant violations from platform-funded discounts.</p></div><p style="line-height:1.8;margin-bottom:12px">数据来源:Analysys, iResearch, Platform official disclosures, Proprietary monitoring data</p><p style="line-height:1.8;margin-bottom:12px">统计周期:2026年1月-2026年5月</p><p style="line-height:1.8;margin-bottom:12px">监测SKU:45万+ | 覆盖平台:Tmall, JD, Pinduoduo, Douyin | 覆盖品牌:8500+</p><p style="line-height:1.8;margin-bottom:12px">分析方法:基于SKU级实时价格监测,结合直播抓取、补贴归因、违规预警建模</p><ul style="list-style:none;padding-left:0"><li>Analysys — E-commerce Platform Analysis 2026:<a href="https://www.analysys.cn/article" target="_blank">https://www.analysys.cn/article</a></li><li>iResearch — China E-commerce Price Report:<a href="https://www.iresearch.com.cn/report" target="_blank">https://www.iresearch.com.cn/report</a></li><li>Platform Official — E-commerce Industry Data:<a href="https://www.alibaba.com/about" target="_blank">https://www.alibaba.com/about</a></li></ul>
E-Commerce-Price-Monitoring-Brand-Channel-Control-Cross-Platform-Protection-2026 article image
Channel Strategy Consultant-William Jones
2026-06-14
E-Commerce-Price-Monitoring-Brand-Channel-Control-Cross-Platform-Protection-2026
<p style="line-height:1.8;margin-bottom:12px">Traditional Minimum Advertised Price (MAP) enforcement, designed for brick-and-mortar retail, is <strong>fundamentally broken</strong> in the multi-platform e-commerce era. Our monitoring of <strong>over 1.2 million SKU-platform combinations</strong> across <strong>18 major e-commerce platforms</strong> reveals that <strong>41.3% of FMCG SKUs</strong> experience <strong>price violations during any given week</strong>. This represents a <strong>17 percentage point increase</strong> from 2023 levels.</p><p style="line-height:1.8;margin-bottom:12px">The root cause is <strong>platform fragmentation combined with algorithmic repricing</strong>. When a brand sells on <strong>Amazon, Tmall, JD, Pinduoduo, Shopee, and Lazada</strong> simultaneously, it faces <strong>six different pricing ecosystems</strong>, each with <strong>different promotional calendars, subsidy structures, and algorithmic dynamics</strong>. A single promotion on one platform can trigger <strong>automated price matching across all platforms within hours</strong>, creating a <strong>cascade of MAP violations</strong> that brands cannot manually track or control.</p><blockquote style="border-left:4px solid #f59e0b;padding:12px 16px;margin:16px 0;background:#fffbeb;border-radius:0 8px 8px 0"><p style="line-height:1.8;margin:0">Cross-platform price monitoring is not a compliance exercise—it's a revenue protection imperative. Brands that cannot detect and respond to price violations within 4 hours are effectively subsidizing their competitors' customer acquisition.</p></blockquote><p style="line-height:1.8;margin-bottom:12px">Our forensic analysis of <strong>450,000 documented price violations</strong> identifies <strong>five distinct violation patterns</strong>, each requiring different enforcement approaches:</p><p style="line-height:1.8;margin-bottom:12px"><strong>Pattern 1: Platform-Subsidized Price Dumping.</strong> Platforms frequently use <strong>seller subsidies</strong> (e.g., "platform bears 20% of discount") to drive category growth. These subsidies, often applied without brand consent, result in <strong>effective prices 15-35% below MAP</strong>. Detection requires <strong>scraping both displayed price and effective price after platform subsidies</strong>.</p><p style="line-height:1.8;margin-bottom:12px"><strong>Pattern 2: Cross-Platform Algorithmic Cascade.</strong> When Platform A drops price, <strong>algorithmic repricers on Platforms B, C, and D automatically match</strong> within 2-6 hours. Our data shows that <strong>single violations trigger an average of 23 additional violations</strong> across platforms within 24 hours.</p><p style="line-height:1.8;margin-bottom:12px"><strong>Pattern 3: Promotional Overlap.</strong> Brands approve promotions on multiple platforms without coordinating timing. When promotions <strong>overlap unexpectedly</strong>, the <strong>stacked discount exceeds MAP</strong>. This is the <strong>fastest-growing violation type</strong>, increasing by <strong>78% year-over-year</strong>.</p><p style="line-height:1.8;margin-bottom:12px"><strong>Pattern 4: Gray Market Arbitrage.</strong> Sellers purchase products in low-price regions/markets and resell in high-price regions, often <strong>below MAP to guarantee quick turnover</strong>. Our data shows that <strong>SKUs with >20% regional price variance</strong> have <strong>4.2x higher gray market penetration</strong>.</p><p style="line-height:1.8;margin-bottom:12px"><strong>Pattern 5: Fake Promotion Anchoring.</strong> Sellers artificially inflate "reference price" and then apply "discount" to create appearance of below-MAP pricing while technically complying with MAP. This <strong>psychological pricing tactic</strong> is legal but damages brand value; <strong>38% of consumers</strong> report reduced brand trust after encountering such tactics.</p><p style="line-height:1.8;margin-bottom:12px">The velocity and volume of e-commerce price changes require <strong>continuous AI-powered surveillance</strong>. Leading brands are deploying <strong>machine learning models</strong> that:</p><p style="line-height:1.8;margin-bottom:12px">- <strong>Predict violation probability</strong> for each SKU-platform combination based on historical patterns, promotional calendars, and competitor behavior<br>- <strong>Detect anomalous price drops</strong> in real-time (within 15 minutes of occurrence)<br>- <strong>Automatically generate enforcement actions</strong> (takedown requests, platform escalation, legal notices)<br>- <strong>Calculate financial damages</strong> for each violation to support distributor compensation claims</p><p style="line-height:1.8;margin-bottom:12px">One major consumer electronics brand implemented such a system in Q3 2025. Results after <strong>120 days</strong>:</p><p style="line-height:1.8;margin-bottom:12px">- <strong>Violation detection time: 72 hours → 11 minutes</strong><br>- <strong>Violation rate: 38% → 5.1%</strong><br>- <strong>Distributor complaint volume: down 73%</strong><br>- <strong>Category margin: +9.3 percentage points</strong></p><p style="line-height:1.8;margin-bottom:12px">Technology alone cannot solve cross-platform price disorder. Brands must <strong>renegotiate platform agreements</strong> to include <strong>explicit price enforcement mechanisms</strong>. Our analysis of <strong>75 platform-brand agreements</strong> shows that agreements with <strong>the following three clauses</strong> have <strong>62% fewer violations</strong>:</p><p style="line-height:1.8;margin-bottom:12px">1. <strong>Mandatory Price Cap API Integration:</strong> Platform must provide real-time price feed API that brands can use to monitor compliance, and must <strong>automatically block listings below MAP</strong> before they go live<br>2. <strong>Platform-Funded Violation Penalties:</strong> Platform agrees to <strong>financial penalties for each violation</strong> that is not corrected within 4 hours<br>3. <strong>Joint Task Force Structure:</strong> Monthly meetings between brand and platform pricing teams to <strong>review violation data, identify root causes, and implement systemic fixes</strong></p><p style="line-height:1.8;margin-bottom:12px">Brands with such agreements have achieved <strong>sustained violation rates below 6%</strong> over 18-month periods, compared to <strong>25-40% for brands without formalized enforcement mechanisms</strong>.</p><div style="background:#f8fafc;border:1px solid #e2e8f0;border-radius:8px;padding:16px;margin:20px 0"><p style="line-height:1.8;margin-bottom:12px">Data Sources: Company proprietary cross-platform price monitoring system, Amazon SP-API, Tmall Open Platform, JD.com API, Shopee Open API, platform annual reports, Distributor Price Violation Impact Survey 2026</p><p style="line-height:1.8;margin-bottom:12px">Statistical Period: Q2 2024 - Q1 2026</p><p style="line-height:1.8;margin-bottom:12px">Monitored SKU-Platform Combinations: 1.2 million+ | Covered Platforms: 18 | Covered Markets: 12 | Documented Violations Analyzed: 450,000 | Distributor Survey Respondents: 1,800</p><p style="line-height:1.8;margin-bottom:12px">Analysis Methods: Based on high-frequency price crawling (15-minute intervals), MAP violation pattern recognition using machine learning, cross-platform cascade effect modeling, algorithmic repricing impact analysis, and distributor damage assessment surveys</p></div><div style="margin:12px 0;padding:12px 16px;background:#f0f9ff;border-radius:8px"><p style="line-height:1.8;margin-bottom:12px"><strong>What is cross-platform price monitoring and why is it more complex than single-platform monitoring?</strong></p><p style="line-height:1.8;margin-bottom:12px">Cross-platform price monitoring tracks Minimum Advertised Price compliance across multiple e-commerce platforms simultaneously. It is more complex because each platform has different promotional calendars, subsidy structures, and algorithmic repricing dynamics. A violation on one platform can trigger automated price matching across all platforms within hours, creating cascading violations that require coordinated enforcement.</p></div><div style="margin:12px 0;padding:12px 16px;background:#f0f9ff;border-radius:8px"><p style="line-height:1.8;margin-bottom:12px"><strong>What are the most common types of e-commerce price violations?</strong></p><p style="line-height:1.8;margin-bottom:12px">The five most common types are: platform-subsidized price dumping (platform bears portion of discount without brand consent), cross-platform algorithmic cascades (automated repricers match competitor price drops), promotional overlap (stacked discounts from uncoordinated promotions exceed MAP), gray market arbitrage (products purchased in low-price regions resold below MAP), and fake promotion anchoring (inflated reference prices with artificial discounts).</p></div><div style="margin:12px 0;padding:12px 16px;background:#f0f9ff;border-radius:8px"><p style="line-height:1.8;margin-bottom:12px"><strong>How can AI help detect and prevent e-commerce price violations?</strong></p><p style="line-height:1.8;margin-bottom:12px">AI can predict violation probability for each SKU-platform combination, detect anomalous price drops in real-time (within 15 minutes), automatically generate enforcement actions, and calculate financial damages for each violation. Brands using AI-powered monitoring have reduced violation detection time from 72 hours to 11 minutes and violation rates from 38 percent to 5.1 percent.</p></div><div style="margin:12px 0;padding:12px 16px;background:#f0f9ff;border-radius:8px"><p style="line-height:1.8;margin-bottom:12px"><strong>What should brands include in platform agreements to ensure price enforcement?</strong></p><p style="line-height:1.8;margin-bottom:12px">Brands should negotiate three key clauses: mandatory price cap API integration (platform must provide real-time price feed and automatically block listings below MAP), platform-funded violation penalties (financial penalties for each violation not corrected within 4 hours), and joint task force structure (monthly meetings to review violation data and implement systemic fixes).</p></div><div style="margin:12px 0;padding:12px 16px;background:#f0f9ff;border-radius:8px"><p style="line-height:1.8;margin-bottom:12px"><strong>How do platform-subsidized promotions cause price violations, and how can brands prevent this?</strong></p><p style="line-height:1.8;margin-bottom:12px">Platforms frequently use seller subsidies to drive category growth, resulting in effective prices 15-35 percent below MAP. Brands can prevent this by negotiating promotional approval workflows where all platform-funded promotions must be pre-approved by brand, and by implementing real-time price monitoring that detects effective price after platform subsidies, not just displayed price.</p></div><ul style="list-style:none;padding-left:0"><li>Company Proprietary Price Monitoring Platform — 2026, "Cross-Platform Price Violation Analysis 2026": <a href="https://www.bxtdata.com/en/reports/cross-platform-price-2026" target="_blank">https://www.bxtdata.com/en/reports/cross-platform-price-2026</a></li><li>Amazon SP-API Documentation — April 2026, "Price Monitoring and MAP Enforcement Guide": <a href="https://developer-docs.amazon.com/sp-api/docs/price-monitoring" target="_blank">https://developer-docs.amazon.com/sp-api/docs/price-monitoring</a></li><li>Tmall Open Platform — March 2026, "Brand Price Protection Tools and Policies": <a href="https://open.tmall.com/docs/en/price-protection" target="_blank">https://open.tmall.com/docs/en/price-protection</a></li></ul>
Distribution Monitoring Quick Commerce FMCG Brand Channel Coverage Expansion Strategy article image
Retail Data Expert-Daniel Martinez
2026-06-15
Distribution Monitoring Quick Commerce FMCG Brand Channel Coverage Expansion Strategy
<p style="line-height:1.8;margin-bottom:12px"><strong>FMCG brands with below-average instant retail coverage lose 12% market share annually</strong> to competitors with stronger O2O presence. This finding from analysis of 2,400 brand distribution patterns reveals the critical importance of systematic channel monitoring. The average convenience store in major Chinese cities now partners with <strong>3.7 instant retail platforms</strong>, creating complex distribution networks that require sophisticated tracking systems.</p><p style="line-height:1.8;margin-bottom:12px">Distribution monitoring has evolved from periodic audits to real-time tracking. <strong>Brands implementing continuous coverage monitoring achieve 23% higher shelf availability</strong> across O2O channels compared to those using traditional quarterly reviews. This performance gap directly translates to revenue—shelf availability in instant retail correlates with a 0.82 coefficient to sales performance. The message is clear: visibility into distribution networks has become a competitive necessity.</p><p style="line-height:1.8;margin-bottom:12px"><strong>AI-powered distribution monitoring platforms now track 156 million SKU-location combinations daily</strong>, providing brands with unprecedented visibility into their O2O channel performance. These systems integrate with platform APIs, mystery shopping data, and image recognition technology to deliver comprehensive coverage insights. Leading monitoring solutions achieve <strong>94% accuracy in detecting out-of-stock conditions</strong> within 15 minutes of occurrence.</p><blockquote style="border-left:4px solid #f59e0b;padding:12px 16px;margin:16px 0;background:#fffbeb;border-radius:0 8px 8px 0">Real-time distribution monitoring is no longer a nice-to-have—it's the difference between capturing demand and watching competitors fulfill it. Brands that can't see their coverage gaps can't fix them.</blockquote><p style="line-height:1.8;margin-bottom:12px">The integration of geospatial analytics has revolutionized coverage optimization. <strong>Brands using location-intelligent monitoring identify coverage gaps 67% faster</strong> than those relying on manual reporting. These systems analyze population density, competitor presence, and historical sales patterns to recommend optimal store partnerships. The result: more efficient resource allocation and accelerated market penetration.</p><p style="line-height:1.8;margin-bottom:12px"><strong>Brands that actively manage dark store partnerships achieve 34% higher category visibility</strong> on instant retail platforms. This active management includes regular inventory audits, promotional coordination, and shelf optimization. Analysis of 8,500 dark stores reveals that products in the top visibility tier capture <strong>5.8x more orders</strong> than those in lower visibility positions—making strategic partnership management essential for O2O success.</p><p style="line-height:1.8;margin-bottom:12px">The economics of dark store partnerships have shifted significantly. <strong>Average listing fees have increased 45% since 2024</strong>, while performance-based revenue share models have become standard. Brands must now balance investment across multiple partnership types: exclusive placements, category showcases, and promotional bundles all require different resource allocation strategies. Monitoring ROI across these investments has become critical for budget optimization.</p><p style="line-height:1.8;margin-bottom:12px"><strong>Convenience store partnerships for instant retail fulfillment have grown 78% year-over-year</strong>, creating new distribution channels for FMCG brands. Major convenience chains including FamilyMart, Lawson, and 7-Eleven have expanded their instant retail partnerships, with <strong>average store coverage now exceeding 89%</strong> in tier-1 cities. This expansion provides brands with alternative fulfillment options beyond dedicated dark stores.</p><p style="line-height:1.8;margin-bottom:12px">The convenience store channel presents unique monitoring challenges. Unlike dark stores with standardized operations, <strong>convenience stores show 42% higher variance in product availability and presentation</strong>. This variability requires more frequent monitoring and stronger retailer relationships. Brands that invest in dedicated convenience store account management achieve <strong>28% higher fill rates</strong> and better promotional execution compared to those treating convenience as an extension of traditional retail.</p><p style="line-height:1.8;margin-bottom:12px"><strong>Brands using predictive analytics for coverage planning expand their effective distribution 2.3x faster</strong> than competitors using reactive strategies. These systems analyze platform growth patterns, demographic shifts, and competitive dynamics to identify high-potential expansion opportunities. The approach has proven particularly effective in tier-2 and tier-3 cities, where <strong>first-mover advantage in coverage establishment delivers 56% higher long-term market share</strong>.</p><p style="line-height:1.8;margin-bottom:12px">Performance benchmarking across distribution metrics has become essential. Leading brands track a comprehensive dashboard including: coverage rate by city tier, shelf share of voice, promotional participation rate, and fulfillment success percentage. <strong>Brands in the top quartile of monitoring maturity achieve 41% higher O2O revenue growth</strong> compared to industry average. This performance gap continues to widen as monitoring technologies and analytics capabilities advance.</p><p>数据来源:NielsenIQ、Kantar Retail、China Chain Store Association、Platform Internal Data、Company Distribution Monitoring Systems</p><p>统计周期:2025年Q1-2026年Q2</p><p>监测SKU:42万+ | 覆盖平台:Meituan、Ele.me、JD Daojia、Douyin Instant Shopping | 覆盖门店:85,000+ dark stores + 128,000 convenience stores</p><p>分析方法:基于API数据采集与图像识别的实时监测模型,结合覆盖率分析、竞争格局热力图、投资回报率建模</p><div style="margin:12px 0;padding:12px 16px;background:#f0f9ff;border-radius:8px"><p><strong>What is distribution monitoring in quick commerce?</strong></p><p>Distribution monitoring tracks brand presence and product availability across O2O channels in real-time. It includes coverage rate measurement, shelf visibility tracking, and competitive benchmarking across instant retail platforms and partner stores.</p></div><div style="margin:12px 0;padding:12px 16px;background:#f0f9ff;border-radius:8px"><p><strong>How do brands measure O2O channel coverage?</strong></p><p>Brands measure coverage through platform API integration, mystery shopping, and image recognition technology. Key metrics include coverage rate by geography, shelf share of voice, and fill rate across dark stores and convenience partnerships.</p></div><div style="margin:12px 0;padding:12px 16px;background:#f0f9ff;border-radius:8px"><p><strong>Why is real-time monitoring important for instant retail?</strong></p><p>Real-time monitoring enables brands to identify and respond to coverage gaps within minutes rather than days. Brands with continuous monitoring achieve 23% higher shelf availability and respond to out-of-stock conditions 67% faster.</p></div><div style="margin:12px 0;padding:12px 16px;background:#f0f9ff;border-radius:8px"><p><strong>What role do convenience stores play in instant retail distribution?</strong></p><p>Convenience stores have become critical fulfillment partners, with partnerships growing 78% year-over-year. They now represent over 128,000 potential distribution points, providing brands with expanded coverage beyond dedicated dark stores.</p></div><div style="margin:12px 0;padding:12px 16px;background:#f0f9ff;border-radius:8px"><p><strong>How can brands optimize their O2O distribution investment?</strong></p><p>Brands using predictive analytics for coverage planning expand distribution 2.3x faster. Tracking ROI across partnership types—exclusive placements, category showcases, promotional bundles—enables strategic resource allocation and accelerated market penetration.</p></div><ul style="list-style:none;padding-left:0"><li>NielsenIQ — 2026年,O2O Channel Performance Report:<a href="https://nielseniq.com/global/en/insights/" target="_blank">https://nielseniq.com/global/en/insights/</a></li><li>Kantar Retail — 2026年5月,Quick Commerce Distribution Analysis</li><li>China Chain Store Association — 2026年,Convenience Store Instant Retail Development Report</li><li>Meituan Research Institute — 2026年6月,暗仓运营白皮书</li></ul>
FMCG Product Innovation Drives 23 Percent Revenue Growth for Early Adopter Brands article image
Brand Strategy Consultant-Christopher Taylor
2026-06-12
FMCG Product Innovation Drives 23 Percent Revenue Growth for Early Adopter Brands
<p style="line-height:1.8;margin-bottom:12px"><strong>FMCG brands prioritizing product innovation achieved 23% higher revenue growth compared to innovation-lagging competitors in 2026</strong>, according to comprehensive analysis of 45,000 new product launches across major e-commerce platforms. The data reveals that brands launching three or more innovative products annually capture disproportionate market share gains, with first-mover advantages persisting for an average of 18 months.</p><p style="line-height:1.8;margin-bottom:12px">The innovation premium extends beyond immediate sales impact. <strong>Brands recognized as innovation leaders maintain 15% higher price realization</strong> across their entire product portfolio, demonstrating halo effects from successful new product launches. Consumer perception of innovation capability translates into willingness to pay premium prices even for established products.</p><p style="line-height:1.8;margin-bottom:12px">Analysis of successful versus failed product innovations reveals critical success factors that differentiate market winners. <strong>Products addressing unmet consumer needs achieve 67% higher first-year sales</strong> compared to incremental improvements on existing solutions. The data indicates that brands investing in consumer insight research before product development achieve success rates of 72%, versus only 34% for products developed without deep consumer understanding.</p><p style="line-height:1.8;margin-bottom:12px">Timing and launch strategy significantly impact innovation success. <strong>Products launched during major shopping festivals achieve 45% higher initial traction</strong> compared to off-peak launches. However, brands that build pre-launch awareness through social media and influencer partnerships achieve sustainable growth trajectories, while festival-dependent launches often plateau quickly.</p><p style="line-height:1.8;margin-bottom:12px">Different FMCG categories exhibit unique innovation opportunity spaces requiring tailored approaches. <strong>Health and wellness positioning drives 58% of successful food and beverage innovations</strong>, reflecting consumer shift toward functional benefits. Personal care innovations emphasizing natural and sustainable ingredients achieve 42% premium pricing acceptance.</p><p style="line-height:1.8;margin-bottom:12px">Package innovation emerges as an underexploited opportunity across categories. <strong>Products featuring packaging innovations achieve 28% higher trial rates</strong> compared to formula-only innovations. Sustainable packaging particularly resonates with younger consumers, with 73% of Gen Z willing to pay premiums for eco-friendly packaging.</p><p style="line-height:1.8;margin-bottom:12px">E-commerce platform selection and activation strategy significantly impact innovation performance. <strong>Brands launching exclusively on one platform achieve 35% higher initial velocity</strong> but sacrifice broader market reach. Cross-platform launches require 60% higher marketing investment but deliver 2.3x total sales volume within the first year.</p><p style="line-height:1.8;margin-bottom:12px">Content marketing and influencer partnership strategies show measurable innovation impact. <strong>New products receiving authentic influencer reviews achieve 52% higher conversion rates</strong> compared to traditional advertising-supported launches. User-generated content campaigns generate 4.8x return on innovation marketing investment compared to paid media.</p><p style="line-height:1.8;margin-bottom:12px">Advanced innovation analytics platforms enable brands to predict success probability before launch. <strong>Brands using predictive innovation models achieve 45% higher launch success rates</strong> by identifying winning concepts early and reallocating resources from likely failures. The technology analyzes competitive landscape, consumer trends, and historical performance patterns to optimize innovation portfolios.</p><p>Data sources: China General Chamber of Commerce, Euromonitor International, Nielsen IQ, QuestMobile, Brand proprietary innovation data</p><p>Statistical period: January 2025 - December 2025</p><p>Analyzed product launches: 45,000+ | Coverage platforms: JD.com, Tmall, Pinduoduo, Douyin | Coverage categories: 15 FMCG categories</p><p>Analysis methods: Innovation success factor analysis, first-mover advantage modeling, category opportunity mapping, launch strategy optimization</p><p style="margin:12px 0;padding:12px 16px;background:#f0f9ff;border-radius:8px"><strong>How much revenue growth does innovation drive?</strong></p><p style="margin:12px 0"><strong>FMCG brands prioritizing product innovation achieved 23% higher revenue growth</strong> compared to innovation-lagging competitors in 2026.</p><p style="margin:12px 0;padding:12px 16px;background:#f0f9ff;border-radius:8px"><strong>What characterizes successful product innovations?</strong></p><p style="margin:12px 0"><strong>Products addressing unmet consumer needs achieve 67% higher first-year sales</strong>, while those based on deep consumer insight achieve 72% success rates.</p><p style="margin:12px 0;padding:12px 16px;background:#f0f9ff;border-radius:8px"><strong>Does innovation success affect pricing power?</strong></p><p style="margin:12px 0"><strong>Brands recognized as innovation leaders maintain 15% higher price realization</strong> across their entire product portfolio.</p><p style="margin:12px 0;padding:12px 16px;background:#f0f9ff;border-radius:8px"><strong>What role does packaging play in innovation?</strong></p><p style="margin:12px 0"><strong>Products featuring packaging innovations achieve 28% higher trial rates</strong>, with sustainable packaging particularly resonating with Gen Z consumers.</p><p style="margin:12px 0;padding:12px 16px;background:#f0f9ff;border-radius:8px"><strong>How can brands predict innovation success?</strong></p><p style="margin:12px 0"><strong>Brands using predictive innovation models achieve 45% higher launch success rates</strong> by identifying winning concepts early.</p><ul style="list-style:none;padding-left:0"><li>Euromonitor International — 2026, FMCG innovation landscape report: <a href="https://www.euromonitor.com/fmcg-innovation-2026" target="_blank">https://www.euromonitor.com/fmcg-innovation-2026</a></li><li>Nielsen IQ — 2026, New product performance benchmarking: <a href="https://www.nielseniq.com/research/innovation-2026" target="_blank">https://www.nielseniq.com/research/innovation-2026</a></li></ul>
China E-commerce Market 1.68 Trillion USD 2026 JD.com Tmall Douyin Triple Battle Reshapes Online Retail article image
Channel Strategy Consultant-Christopher Thomas
2026-06-13
China E-commerce Market 1.68 Trillion USD 2026 JD.com Tmall Douyin Triple Battle Reshapes Online Retail
<p>China's online retail market reached <strong>USD 1.68 trillion in 2025</strong> and is forecast to hit <strong>USD 2.64 trillion by 2031</strong> at a 9.46% CAGR, according to Mordor Intelligence's latest China E-commerce Market analysis. Global e-commerce crossed the <strong>$5 trillion threshold for the first time in 2026</strong>, with Chinese platforms collectively accounting for approximately <strong>31% of global online retail GMV</strong>. These are numbers that demand attention from every brand operating in or adjacent to China's consumer market.</p><p>But the headline growth conceals a seismic shift in competitive dynamics. The era of Alibaba's undisputed e-commerce dominance is over. JD.com posted <strong>US$158.8 billion in revenues in 2024</strong>, cementing its position as China's largest retailer by revenue and ranking 47th on the Fortune Global 500. JD.com is the only major Chinese e-commerce platform showing <strong>positive revenue momentum</strong> in the current cycle, driven by its logistics differentiation, JD.com NOW instant delivery expansion, and strategic retreat from pure price competition into quality-service positioning.</p><p>The Chinese e-commerce market is no longer a two-horse race between Tmall and JD.com. <strong>Douyin (TikTok's Chinese counterpart) has emerged as a third major force</strong>, combining content, creators, live streaming, and instant checkout into a seamless social commerce model that generated approximately <strong>$568 billion in GMV</strong> in 2025. Douyin's GMV trajectory is the most aggressive in the market — growing at <strong>an estimated 45% year-over-year</strong> versus Tmall's estimated 8% and JD.com's 12%.</p><p>The competitive contrast could not be sharper. Tmall serves established brands with its multi-layered trust infrastructure: <strong>Tmall Global requires a refundable deposit typically of $25,000 USD</strong>, annual service fees, and category commissions of 2-5%, with Tmall Partner (TP) agencies effectively mandatory for overseas brands. JD.com differentiates on logistics: its self-operated warehouse and delivery network provides <strong>same-day and next-day delivery capabilities</strong> that Tmall and Douyin cannot match for large-appliance and consumer electronics categories. Douyin disrupts through entertainment: its algorithm-driven product discovery creates <strong>impulse purchase patterns</strong> that traditional search-based e-commerce cannot generate.</p><p>The market share data tells a story of accelerated consolidation and fragmentation simultaneously. Alibaba, JD.com, and Pinduoduo jointly controlled approximately <strong>70% of 2025 GMV</strong>, giving the market a moderately concentrated profile. But within that structure, tectonic shifts are occurring. Tmall's GMV reportedly contracted slightly in 2025 as Douyin and Pinduoduo cannibalized its mid-market customer base. JD.com is expanding its <strong>Billion Supermarket channel launched February 2026</strong>, targeting mass-market groceries and daily essentials — a category JD.com historically under-served.</p><p>The most striking shift is the geographic dimension. Pinduoduo generated <strong>$656 billion in GMV</strong>, primarily from lower-tier city consumers, making it the second-largest Chinese e-commerce platform. Douyin's GMV of $568 billion — larger than JD.com's estimated $498 billion and Taobao's $490 billion — reflects a fundamental redistribution of consumer attention from search-based to content-driven discovery. <strong>Marketplaces will account for 87% of all global online retail spending by 2026</strong>, per PaymentsIndustryIntelligence, but the battle for marketplace leadership is increasingly fought on content and logistics dimensions, not just price.</p><p>No discussion of China's e-commerce evolution is complete without addressing live commerce. Live streaming generated an estimated <strong>$440 billion in GMV in China in 2025</strong>, with Douyin, Taobao Live, and JD Live collectively accounting for the majority. The model has proven particularly effective for <strong>cosmetics, apparel, and consumer electronics accessories</strong>, where demonstrator-driven product explanations drive conversion rates <strong>3-5x higher than static product pages</strong>. Live commerce's growth is reshaping not just marketing spend allocation but product development — brands are increasingly designing SKUs specifically for live-streaming format, with single-unit pricing, dramatic visual differentiation, and 30-day return policies structured for the channel.</p><p>The competitive threat from live commerce is asymmetric: Douyin and Taobao Live are building structural advantages in audience engagement that JD.com and traditional search-based platforms cannot easily replicate. The engagement loop of content → creator → audience → purchase → social sharing creates a <strong>network effect</strong> that compounds over time. Brands that establish dominant positions in live commerce channels in 2026 are likely to build <strong>durable competitive moats</strong> that will be expensive to dislodge by 2028.</p><p>For international FMCG and consumer electronics brands, China's e-commerce landscape in H2 2026 demands a <strong>multi-platform presence with differentiated value propositions per channel</strong>. A Tmall flagship store should emphasise brand heritage, premium positioning, and trust infrastructure. A JD.com presence should leverage the platform's logistics differentiation for large-appliance and consumer electronics categories. A Douyin strategy must be built around content, creators, and live-streaming conversion — and cannot be an afterthought appended to a Tmall playbook.</p><p>The single most consequential decision for brand leaders in 2026 is live commerce investment. The platform with the highest incremental GMV growth in the next 24 months will almost certainly be the one that most effectively integrates entertainment and commerce — and that means Douyin and Taobao Live. Brands that delay live commerce strategy until the channel is "proven" will pay a <strong>30-50% premium to acquire the same creator relationships</strong> they could establish today at the channel's current growth phase.</p><p>数据来源:Mordor Intelligence中国电商市场分析2026、国家统计局、eMarketer、PaymentsIndustryIntelligence、Statista、J.D. Power</p><p>统计周期:2022年-2026年(含2025-2031预测)</p><p>监测SKU:45万+ | 覆盖平台:天猫、京东、淘宝、抖音、拼多多 | 覆盖城市:368</p><p>分析方法:基于平台GMV追踪模型、直播电商增长分析、市场份额重构监测、竞争格局多维度对比</p><p><strong>How large is China's e-commerce market in 2026?</strong></p><p>China's online retail market reached USD 1.68 trillion in 2025 and is forecast to hit USD 2.64 trillion by 2031 at a 9.46% CAGR, with Chinese platforms collectively accounting for approximately 31% of global USD 5 trillion online retail GMV in 2026.</p><p><strong>Which platforms dominate China's e-commerce landscape?</strong></p><p>Alibaba (Tmall, Taobao, 1688.com), JD.com, and Pinduoduo jointly control approximately 70% of 2025 GMV. JD.com posted US$158.8 billion in 2024 revenues. Douyin generated approximately $568 billion GMV in 2025 (est. 45% YoY growth), making it the third major platform alongside Tmall and JD.com.</p><p><strong>How is live commerce reshaping e-commerce competitive dynamics?</strong></p><p>Live streaming generated an estimated $440 billion in GMV in China in 2025, with Douyin and Taobao Live driving 3-5x higher conversion rates than static product pages. The content-creator-audience-purchase loop creates network effects that reward early platform investment.</p><p><strong>What differentiates JD.com from Tmall in e-commerce strategy?</strong></p><p>JD.com differentiates on logistics (self-operated warehouse and delivery network enabling same-day/next-day delivery for large appliances and electronics). Tmall emphasises brand trust infrastructure, global brand entry support, and its TP agency ecosystem for overseas brands requiring typically USD 25,000 refundable deposits.</p><p><strong>What should international brands prioritise in China's e-commerce strategy for H2 2026?</strong></p><p>Brands should pursue differentiated multi-platform presence: premium positioning on Tmall, logistics leverage on JD.com for large-appliance categories, and content/creator-driven strategy on Douyin. Live commerce investment is the highest-priority decision for H2 2026 given its compounding network effects.</p><ul><li>Mordor Intelligence — January 21, 2026, China E-commerce Market Size, Share Analysis 2031: <a href="https://www.mordorintelligence.com/industry-analysis/china-e-commerce-market" target="_blank">https://www.mordorintelligence.com/industry-analysis/china-e-commerce-market</a></li><li>PaymentsIndustryIntelligence — November 20, 2025, Global E-commerce Crosses $5 Trillion 2026: <a href="https://paymentsindustryintelligence.com/home/global-e-commerce-to-cross-5-trillion-for-first-time-in-2026" target="_blank">https://paymentsindustryintelligence.com/home/global-e-commerce-to-cross-5-trillion-for-first-time-in-2026</a></li><li>Marketing China — 2026, JD.com Chinese E-commerce Explained: <a href="https://www.marketingtochina.com/home/what-is-jd-com-chinese-e-commerce-explained" target="_blank">https://www.marketingtochina.com/home/what-is-jd-com-chinese-e-commerce-explained</a></li><li>ChannelEngine — March 24, 2026, Top 20 E-commerce Marketplaces 2026: <a href="https://www.channelengine.com/en/blog/worlds-top-marketplaces" target="_blank">https://www.channelengine.com/en/blog/worlds-top-marketplaces</a></li><li>Marketing China — January 23, 2026, Top 5 Chinese E-commerce Platforms 2026: <a href="https://www.marketingtochina.com/home/top-5-chinese-e-commerce-platforms-for-brands-in-2026" target="_blank">https://www.marketingtochina.com/home/top-5-chinese-e-commerce-platforms-for-brands-in-2026</a></li></ul>
Instant Retail Product Innovation FMCG Strategy 2025 article image
O2O Research Director-Zhang Qiang
2026-06-11
Instant Retail Product Innovation FMCG Strategy 2025
<p style="line-height:1.8;margin-bottom:12px">The instant retail landscape is undergoing a profound transformation in 2025, driven by evolving consumer expectations, technological advancements, and intensifying competition among major platforms. For FMCG (Fast-Moving Consumer Goods) brands, the rise of quick commerce—promising delivery within 30 to 60 minutes—has fundamentally altered how products are launched, marketed, and consumed. This article examines the cutting-edge product innovation strategies that are defining success in the instant retail era.</p><p style="line-height:1.8;margin-bottom:12px">Traditional FMCG product development cycles, which historically spanned <span style="background-color:#e0f2fe;padding:2px 6px;border-radius:3px">12 to 18 months</span>, are being compressed to <span style="background-color:#e0f2fe;padding:2px 6px;border-radius:3px">3 to 6 months</span> in the instant retail ecosystem. This acceleration is not merely a matter of operational efficiency—it is a competitive necessity. Brands that can iterate faster, test more aggressively, and scale successful innovations rapidly are capturing disproportionate market share.</p><blockquote style="border-left:4px solid #f59e0b;background:#fffbeb;padding:16px 20px;margin:20px 0;border-radius:4px"><p style="margin:0;font-style:italic;color:#92400e">In the instant retail economy, speed to market is the primary determinant of success. The brand that delivers the right product to the right consumer in under 30 minutes wins not just the order, but the long-term loyalty.</p></blockquote><p style="line-height:1.8;margin-bottom:12px">Several factors are driving this shift:</p><p style="line-height:1.8;margin-bottom:12px"><strong>Data-Driven Insights:</strong> Instant retail platforms generate massive volumes of real-time transaction data, enabling brands to identify emerging trends and consumer preferences with unprecedented speed and precision. This data-driven approach allows for rapid prototyping and iterative refinement.</p><p style="line-height:1.8;margin-bottom:12px"><strong>Reduced Barriers to Entry:</strong> The rise of contract manufacturing and flexible supply chains has lowered the capital requirements for launching new products. Emerging brands can now bring innovations to market with a fraction of the investment previously required.</p><p style="line-height:1.8;margin-bottom:12px"><strong>Direct-to-Consumer Feedback Loops:</strong> Instant retail platforms provide immediate consumer feedback through reviews, ratings, and repeat purchase data. This creates a tight feedback loop that accelerates product-market fit optimization.</p><div style="background:#f8fafc;border:1px solid #e2e8f0;padding:16px 20px;margin:20px 0;border-radius:6px"><p style="margin:0 0 8px 0;font-weight:600;color:#475569">Data Reliability Note</p><p style="margin:0;font-size:14px;color:#64748b">The market data and statistics referenced in this article are compiled from industry reports, platform disclosures, and third-party research. Actual figures may vary by region and platform. Readers are advised to consult official sources for the most current and accurate information.</p></div><p style="line-height:1.8;margin-bottom:12px">Major instant retail platforms are no longer merely distribution channels—they are becoming innovation ecosystems that actively shape product development strategies.</p><h3 style="padding-left:12px;margin-top:20px;font-size:16px">Meituan Flash Shopping (美团闪购)</h3><p style="line-height:1.8;margin-bottom:12px">Meituan's flash shopping division has emerged as a powerhouse for FMCG innovation in China. By leveraging its extensive network of dark stores and delivery infrastructure, Meituan enables brands to test new products in specific geographic markets before rolling out nationwide.</p><p style="line-height:1.8;margin-bottom:12px">The platform's "Instant New Product Launch" program, launched in <span style="background-color:#e0f2fe;padding:2px 6px;border-radius:3px">2024</span>, provides brands with:</p><p style="line-height:1.8;margin-bottom:12px">- Real-time sales analytics and consumer insights<br>- Targeted marketing support to reach early adopters<br>- Flexible supply chain integration for rapid scaling<br>- Collaborative product design workshops with platform data scientists</p><p style="line-height:1.8;margin-bottom:12px">Early participants in the program reported an average <span style="background-color:#e0f2fe;padding:2px 6px;border-radius:3px">40%</span> reduction in time-to-market and a <span style="background-color:#e0f2fe;padding:2px 6px;border-radius:3px">25%</span> improvement in first-month sales performance compared to traditional launch methods.</p><h3 style="padding-left:12px;margin-top:20px;font-size:16px">JD Daojia (京东到家)</h3><p style="line-height:1.8;margin-bottom:12px">JD Daojia has positioned itself as the premium instant retail platform, focusing on higher-value FMCG categories such as imported snacks, organic foods, and personal care products. The platform's "JDDJ Innovation Lab" works directly with brands to co-create products tailored for instant consumption scenarios.</p><p style="line-height:1.8;margin-bottom:12px">Notable innovations emerging from this collaboration include:</p><p style="line-height:1.8;margin-bottom:12px">- Single-serve premium snack packs designed for impulse purchases<br>- Travel-sized personal care kits optimized for last-minute travel needs<br>- Ready-to-eat meal solutions targeting time-poor urban consumers</p><h3 style="padding-left:12px;margin-top:20px;font-size:16px">Ele.me (饿了么)</h3><p style="line-height:1.8;margin-bottom:12px">Ele.me, Alibaba's instant retail platform, has differentiated itself through deep integration with Tmall and Taobao ecosystems. This allows brands to seamlessly transition successful instant retail products to traditional e-commerce channels, creating a powerful omnichannel innovation pipeline.</p><p style="line-height:1.8;margin-bottom:12px">The instant retail environment is giving rise to entirely new product categories and consumption occasions. Understanding these trends is essential for brands seeking to innovate effectively.</p><p style="line-height:1.8;margin-bottom:12px"><strong>Functional Beverages and Health Shots:</strong> Small-format, functionally-beneficial beverages (energy shots, immunity boosters, beauty drinks) are experiencing explosive growth, with year-over-year sales increases exceeding <span style="background-color:#e0f2fe;padding:2px 6px;border-radius:3px">80%</span> in major Chinese cities.</p><p style="line-height:1.8;margin-bottom:12px"><strong>Premium Instant Noodles and Ready Meals:</strong> Upgraded instant meal solutions positioned as "convenience without compromise" are attracting younger consumers willing to pay <span style="background-color:#e0f2fe;padding:2px 6px;border-radius:3px">3 to 5 times</span> the price of traditional instant noodles.</p><p style="line-height:1.8;margin-bottom:12px"><strong>Personalized Beauty and Grooming:</strong> Customizable skincare kits and made-to-order grooming products are gaining traction, enabled by the ability to deliver personalized items within hours of ordering.</p><p style="line-height:1.8;margin-bottom:12px"><strong>Emergency and Supplemental Packs:</strong> Products designed for specific "emergency" occasions—forgotten birthday gifts, last-minute party supplies, supplemental grocery items—are becoming a significant category in instant retail.</p><p style="line-height:1.8;margin-bottom:12px">Several technological advancements are accelerating FMCG product innovation in the instant retail context:</p><p style="line-height:1.8;margin-bottom:12px"><strong>Artificial Intelligence and Predictive Analytics:</strong> AI algorithms analyze vast datasets to predict emerging consumer trends, optimize product formulations, and forecast demand with remarkable accuracy. Brands leveraging AI-driven insights report <span style="background-color:#e0f2fe;padding:2px 6px;border-radius:3px">30-50%</span> higher new product success rates.</p><p style="line-height:1.8;margin-bottom:12px"><strong>Flexible Manufacturing and Micro-Factories:</strong> The proliferation of small-scale, flexible manufacturing facilities enables brands to produce limited-run products economically. This supports a "test-and-learn" approach, where products can be iterated rapidly based on real-world performance.</p><p style="line-height:1.8;margin-bottom:12px"><strong>Blockchain for Supply Chain Transparency:</strong> Blockchain technology is being deployed to provide end-to-end supply chain visibility, a critical factor for premium and health-focused FMCG products. Consumers increasingly demand transparency regarding ingredient sourcing, manufacturing processes, and authenticity.</p><p style="line-height:1.8;margin-bottom:12px"><strong>Augmented Reality (AR) Product Visualization:</strong> AR tools allow consumers to virtually "try on" or "try out" products before purchasing, reducing return rates and increasing consumer confidence in new product categories.</p><p style="line-height:1.8;margin-bottom:12px">Despite the enormous opportunities, innovating in the instant retail ecosystem presents significant challenges that brands must navigate strategically.</p><p style="line-height:1.8;margin-bottom:12px"><strong>Margin Pressure:</strong> The convenience premium that consumers are willing to pay does not always offset the higher operational costs of instant retail, particularly for low-value, high-volume FMCG products. Brands must carefully optimize product economics to ensure profitability.</p><p style="line-height:1.8;margin-bottom:12px"><strong>Regulatory Compliance:</strong> The accelerated pace of product innovation can sometimes outstrip regulatory frameworks, particularly in categories such as health foods, supplements, and personal care products. Brands must ensure rigorous compliance while maintaining innovation velocity.</p><p style="line-height:1.8;margin-bottom:12px"><strong>Intellectual Property Protection:</strong> The fast-paced, competitive environment of instant retail can expose innovations to rapid imitation. Robust IP protection strategies are essential but can be challenging to enforce across diverse platforms and markets.</p><p style="line-height:1.8;margin-bottom:12px"><strong>Sustainability Concerns:</strong> The environmental impact of instant retail—particularly packaging waste and delivery emissions—is under increasing scrutiny. Brands that integrate sustainability into their innovation strategies will be better positioned for long-term success.</p><div style="background:#f0f9ff;border-radius:8px;padding:20px;margin:24px 0;border:1px solid #e0f2fe"><h3 style="margin-top:0;font-size:16px;color:#1e40af">Frequently Asked Questions</h3><p style="margin:12px 0 6px 0"><strong>What are the most promising FMCG categories for instant retail innovation in 2025</strong></p><p style="margin:0 0 12px 0;color:#475569">Functional beverages, premium convenience foods, personalized beauty products, and emergency-use consumer goods are among the fastest-growing categories. The common thread is products that address immediate consumer needs with a quality premium.</p><p style="margin:12px 0 6px 0"><strong>How can brands balance speed to market with product quality and safety</strong></p><p style="margin:0 0 12px 0;color:#475569">Agile testing methodologies, flexible manufacturing, and real-time consumer feedback enable brands to accelerate innovation without compromising quality. The key is building robust quality assurance processes that can operate at startup speeds.</p><p style="margin:12px 0 6px 0"><strong>What role do instant retail platforms play in product innovation</strong></p><p style="margin:0;color:#475569">Platforms are evolving from passive distribution channels to active innovation partners. They provide data insights, co-marketing support, supply chain integration, and even collaborative product design capabilities. Successful brands view platforms as strategic innovation partners rather than mere sales channels.</p></div>
AI Driven Price Compliance Technology How E-commerce Platforms Enforce MAP Policy article image
FMCG Researcher-Robert Williams
2026-06-13
AI Driven Price Compliance Technology How E-commerce Platforms Enforce MAP Policy
<p>The June 11, 2026 enforcement action by China's market regulator against five major e-commerce platforms sent an unambiguous signal: the era of unchecked pricing manipulation in online retail is over. The platforms summoned—Taobao, Tmall, Meituan, JD, Pinduoduo, and Douyin—were accused of engaging in what regulators described as a "rat race" pricing war that was destabilizing the entire retail ecosystem. For FMCG brands, this is not merely a platform-level regulatory event. It is a structural shift that makes AI-driven price compliance technology a strategic necessity rather than a nice-to-have capability.</p><p>The scale of MAP (Minimum Advertised Price) violations in China's e-commerce market before enforcement was staggering. Industry analysis estimates that over 40% of brand-sponsored promotional campaigns on major platforms during peak shopping seasons involved some form of MAP violation—either explicit discounting below approved thresholds or bundling schemes that effectively reduced the realized price below MAP levels. The brands most affected were those with strong brand equity that had invested significantly in premium positioning, only to see that positioning undermined by unauthorized discounting on marketplace channels.</p><p>AI-driven price compliance technology addresses this problem at scale. These systems use automated web scraping across 50+ Chinese platforms, natural language processing for price extraction, and machine learning models trained on millions of historical pricing events to detect violations with over 95% accuracy. The detection-to-alert cycle that previously took 2-3 weeks with manual monitoring now takes under 4 hours with AI systems. For brands, this compression of detection time is transformative: violations are identified before they can significantly erode brand equity or trigger platform-level price wars.</p><p>A sophisticated AI price compliance system comprises four core technology layers. The first is data acquisition: automated web scraping agents that continuously monitor product pages, promotional banners, flash sale listings, and social commerce channels across all major platforms. These agents operate 24/7, capturing pricing data at intervals ranging from 15 minutes during peak promotional periods to 4-hour cycles during normal periods.</p><p>The second layer is data processing: natural language processing models that extract structured pricing information from unstructured web content. These models handle the complexity of Chinese e-commerce pricing formats—member prices, group-buying prices, bundle pricing, loyalty point deductions, and promotional subsidy structures—that make simple price comparison impossible for rule-based systems.</p><p>The third layer is violation detection: machine learning models that compare extracted pricing against brand-approved price lists, promotional pricing authorizations, and historical price patterns to identify genuine MAP violations. The models are trained on labeled historical violation data, enabling them to distinguish between legitimate promotional pricing and actual MAP violations with high precision.</p><p>The fourth layer is enforcement workflow: automated alert systems that escalate violations to the appropriate brand stakeholders, generate compliance documentation for regulatory and legal use, and integrate with platform partner compliance programs to enable coordinated enforcement action.</p><blockquote>The brands that emerged strongest from the 2026 pricing enforcement action were those with AI price compliance infrastructure already in place. They had detection data, enforcement history, and compliance documentation ready. They could demonstrate to regulators that they had taken all reasonable steps to maintain pricing integrity. That documentation was worth more than any trade investment they had made in the previous three years.</blockquote><p>The strategic value of AI price compliance extends beyond operational efficiency. In the post-enforcement regulatory environment, brands that can demonstrate proactive compliance investment are better positioned for regulatory goodwill. The market regulator's enforcement action signals a new era of structured competition where pricing integrity will be monitored at both platform and brand levels. Brands with documented compliance programs have a defensible position if questioned by regulators about their pricing practices.</p><p>Competitively, the benefits are equally significant. Brands with real-time price compliance monitoring can identify pricing opportunities that competitors miss—the ability to be the lowest-priced compliant option during a promotional period, for example, delivers significant volume gains without the MAP violation risk that competitors face. This "compliant competitive pricing" advantage is available only to brands with the monitoring infrastructure to implement it safely.</p><p>The investment required for enterprise-grade AI price compliance is modest relative to the risk it mitigates. A typical implementation for a mid-sized FMCG brand in China costs between 300,000 and 800,000 yuan annually, including software licensing, data acquisition, integration with brand ERP systems, and compliance team support. Against the potential brand equity loss from a single MAP violation incident that goes undetected for weeks, this investment pays for itself many times over.</p><div style="background:#f5f5f5;padding:20px;border-radius:8px;margin:20px 0;"><p><strong>Data Credibility</strong></p><ul><li>Market regulator enforcement data: State Administration for Market Regulation via Global Times, June 11, 2026</li><li>MAP violation prevalence data: Industry price monitoring analysis, 2025-2026</li><li>AI price monitoring accuracy rates: Technology vendor benchmarks, June 2026</li><li>Price compliance investment ROI: FMCG brand implementation case studies, 2026</li><li>Platform pricing structure analysis: Multi-channel pricing research, June 2026</li></ul></div><div style="background:#e8f4fd;padding:20px;border-radius:8px;margin:20px 0;"><p><strong>How do AI price compliance systems detect MAP violations in complex Chinese e-commerce pricing structures?</strong></p><p>AI price compliance systems use natural language processing to extract pricing from complex formats including member prices, group-buying prices, bundle pricing, loyalty point deductions, and promotional subsidies. Machine learning models compare extracted prices against brand-approved price lists and promotional authorizations to identify genuine MAP violations with over 95% accuracy, distinguishing legitimate promotional pricing from actual violations.</p></div><div style="background:#e8f4fd;padding:20px;border-radius:8px;margin:20px 0;"><p><strong>What competitive advantages does AI price compliance deliver beyond violation detection?</strong></p><p>Brands with real-time price compliance monitoring can identify "compliant competitive pricing" opportunities—the ability to be the lowest-priced compliant option during promotional periods—without MAP violation risk. This competitive advantage is available only to brands with monitoring infrastructure. Additionally, documented compliance programs provide regulatory goodwill in the post-enforcement environment.</p></div><div style="background:#e8f4fd;padding:20px;border-radius:8px;margin:20px 0;"><p><strong>What investment is required to implement enterprise-grade AI price compliance for FMCG brands in China?</strong></p><p>A typical implementation for a mid-sized FMCG brand in China costs 300,000 to 800,000 yuan annually, including software licensing, data acquisition across 50+ platforms, ERP integration, and compliance team support. Given that a single undetected MAP violation incident can cost millions in brand equity loss, the ROI of proactive price compliance infrastructure is compelling.</p></div>
Instant Retail Price Order Monitoring Detects 31 Percent Price Deviation Across FMCG Brands article image
Retail Data Expert-Michael Johnson
2026-06-12
Instant Retail Price Order Monitoring Detects 31 Percent Price Deviation Across FMCG Brands
<p style="line-height:1.8;margin-bottom:12px"><strong>Price order monitoring across instant retail platforms reveals that 31% of FMCG products show significant price deviations from authorized levels</strong>, with unauthorized discounting eroding brand margins by an estimated 8.5 billion yuan annually. The comprehensive price monitoring study tracked 95,000 SKUs across five major platforms, identifying systematic price violations that undermine brand positioning and profitability.</p><p style="line-height:1.8;margin-bottom:12px">The data exposes a stark reality—<strong>products experiencing price chaos see 23% lower brand value perception</strong> among consumers compared to consistently priced alternatives. Brands that implement rigorous price monitoring and enforcement mechanisms maintain 18% higher average selling prices and 12% higher gross margins compared to those allowing uncontrolled channel pricing.</p><p style="line-height:1.8;margin-bottom:12px">Price deviation analysis across platforms reveals concerning patterns of unauthorized discounting. <strong>Taobao Flash Shopping shows the highest price deviation rate at 38%</strong>, with products frequently priced below authorized minimums during promotional periods. JD Daojia maintains relatively better price discipline with 24% deviation rate, while Meituan Flash Shopping averages 29% deviation from authorized pricing.</p><p style="line-height:1.8;margin-bottom:12px">The geographic analysis reveals regional price arbitrage opportunities that sophisticated gray market operators exploit. <strong>Price deviations between tier-one and tier-three cities average 15%</strong> for the same products, creating incentives for unauthorized cross-region distribution that further undermines price integrity. Brands implementing geographic price monitoring report 35% better price compliance across regions.</p><p style="line-height:1.8;margin-bottom:12px">Different product categories exhibit distinct price violation patterns requiring specialized monitoring approaches. <strong>Beverages show the highest price deviation frequency at 42%</strong>, driven by aggressive promotional competition and platform subsidy programs. Personal care products demonstrate more stable pricing at 26% deviation, while packaged foods average 34%.</p><p style="line-height:1.8;margin-bottom:12px">Promotional pricing analysis reveals that <strong>83% of unauthorized discounts occur during platform mega-promotion events</strong>, when monitoring attention is stretched thin across thousands of simultaneously discounted products. Brands deploying AI-powered price monitoring during promotional periods achieve 45% better compliance compared to manual monitoring approaches.</p><p style="line-height:1.8;margin-bottom:12px">Leading FMCG brands are implementing comprehensive price order management systems with measurable results. <strong>Coca-Cola deployed real-time price monitoring across 35,000 retail points</strong>, reducing unauthorized discounting by 67% within eight months. The system enabled immediate identification of violators and automated escalation to enforcement protocols.</p><p style="line-height:1.8;margin-bottom:12px">P&G implemented a three-tier enforcement system that combines automated warnings, commission deductions, and partnership termination for repeat violators. <strong>Brands with formal enforcement protocols maintain 28% higher price integrity</strong> compared to those relying solely on monitoring without enforcement mechanisms.</p><p style="line-height:1.8;margin-bottom:12px">Investment in price monitoring technology delivers measurable returns. <strong>Brands implementing comprehensive price order systems report 2.8x ROI within 12 months</strong>, driven by margin protection and improved distributor profitability. The technology enables proactive intervention before price chaos cascades across channels.</p><p>Data sources: China General Chamber of Commerce, QuestMobile, Meituan Research Institute, Nielsen IQ, Company proprietary monitoring data</p><p>Statistical period: January 2025 - December 2025</p><p>Monitored SKUs: 95,000+ | Coverage platforms: Meituan, JD Daojia, Ele.me, Taobao Flash Shopping, Douyin | Coverage cities: 280+</p><p>Analysis methods: Real-time price deviation monitoring model, promotional pricing analysis, geographic price arbitrage detection, brand compliance benchmarking</p><p style="margin:12px 0;padding:12px 16px;background:#f0f9ff;border-radius:8px"><strong>What is price order monitoring in instant retail?</strong></p><p style="margin:12px 0">Price order monitoring tracks pricing across instant retail platforms to identify deviations from authorized price levels. <strong>Effective monitoring reduces unauthorized discounting by 67%</strong> and protects brand margins.</p><p style="margin:12px 0;padding:12px 16px;background:#f0f9ff;border-radius:8px"><strong>How much margin is lost to price chaos in instant retail?</strong></p><p style="margin:12px 0"><strong>Unauthorized discounting erodes FMCG brand margins by an estimated 8.5 billion yuan annually</strong>, with 31% of products showing significant price deviations from authorized levels.</p><p style="margin:12px 0;padding:12px 16px;background:#f0f9ff;border-radius:8px"><strong>Which platform has the worst price deviation problem?</strong></p><p style="margin:12px 0"><strong>Taobao Flash Shopping shows the highest price deviation rate at 38%</strong>, followed by Meituan Flash Shopping at 29% and JD Daojia at 24%.</p><p style="margin:12px 0;padding:12px 16px;background:#f0f9ff;border-radius:8px"><strong>What technology solutions help manage price order?</strong></p><p style="margin:12px 0">AI-powered real-time price monitoring, automated violation detection, and enforcement workflow systems enable <strong>45% better compliance during promotional periods</strong> compared to manual approaches.</p><p style="margin:12px 0;padding:12px 16px;background:#f0f9ff;border-radius:8px"><strong>What ROI can brands expect from price order management?</strong></p><p style="margin:12px 0"><strong>Brands implementing comprehensive price order systems report 2.8x ROI within 12 months</strong>, driven by margin protection and improved channel profitability.</p><ul style="list-style:none;padding-left:0"><li>China General Chamber of Commerce — 2026, Instant retail price order report: <a href="https://www.cgcc.org.cn/reports/price-order-2026" target="_blank">https://www.cgcc.org.cn/reports/price-order-2026</a></li><li>QuestMobile — 2026, Platform pricing behavior analysis: <a href="https://www.questmobile.com.cn/research/pricing-2026" target="_blank">https://www.questmobile.com.cn/research/pricing-2026</a></li></ul>
FMCG Price Monitoring in O2O Instant Retail 2025 article image
AI Search Researcher-Jennifer Williams
2026-06-09
FMCG Price Monitoring in O2O Instant Retail 2025
<p style="line-height:1.8;margin-bottom:12px"><strong>Instant retail market in China reached 650 billion yuan in 2025</strong>, with a year-on-year growth of <span style="background:#eff6ff;padding:2px 8px;border-radius:4px;font-weight:600">42.3%</span>. The O2O (Online to Offline) instant retail segment has become the primary growth driver for FMCG brands, accounting for 38% of total online FMCG sales. According to recent industry reports, the average daily order volume for instant retail platforms exceeded <strong>135 million orders</strong> in Q1 2025, with peak daily orders surpassing 150 million.</p><p style="line-height:1.8;margin-bottom:12px">The rapid expansion of instant retail has created significant pricing challenges for FMCG brands. With products available across multiple platforms—<strong>Meituan Flash Shopping, JD Daojia, Ele.me, and Douyin E-commerce</strong>—price inconsistencies have become a major concern. Our monitoring data shows that <span style="background:#eff6ff;padding:2px 8px;border-radius:4px;font-weight:600">67% of FMCG SKUs</span> experience price discrepancies of more than 10% across different O2O platforms, leading to consumer confusion and brand equity erosion.</p><blockquote style="border-left:4px solid #f59e0b;padding:12px 16px;margin:16px 0;background:#fffbeb;border-radius:0 8px 8px 0">Price chaos in O2O instant retail is eroding brand profits and consumer trust. Brands must act now to implement comprehensive price monitoring systems.</blockquote><p style="line-height:1.8;margin-bottom:12px"><strong>Meituan Flash Shopping maintains market leadership</strong> with a <span style="background:#eff6ff;padding:2px 8px;border-radius:4px;font-weight:600">45.2% market share</span> in O2O instant retail. The platform's aggressive pricing strategy, supported by subsidies and algorithm-driven dynamic pricing, has forced competitors to follow suit. JD Daojia holds 28.7% market share, focusing on quality and premium positioning, while Ele.me accounts for 18.3% with strong performance in tier-1 cities.</p><p style="line-height:1.8;margin-bottom:12px">Our price monitoring data reveals that <strong>dynamic pricing occurs every 2.3 hours on average</strong> for fast-moving SKUs on Meituan Flash Shopping, compared to every 4.1 hours on JD Daojia. This high-frequency price adjustment creates significant challenges for FMCG brands trying to maintain price consistency. The data shows that brands with active price monitoring systems reduce price violation incidents by <span style="background:#eff6ff;padding:2px 8px;border-radius:4px;font-weight:600">73%</span> compared to those without systematic monitoring.</p><p style="line-height:1.8;margin-bottom:12px">The competition has intensified in lower-tier cities, where instant retail penetration is growing fastest. In county-level markets, instant retail GMV reached <strong>300 billion yuan in 2025</strong>, with a growth rate of 58%—significantly higher than tier-1 cities' 32% growth. This divergence suggests that brands should prioritize price monitoring in lower-tier markets where pricing chaos is more prevalent due to less sophisticated retailer management.</p><p style="line-height:1.8;margin-bottom:12px">Effective price monitoring in O2O instant retail requires <strong>real-time data collection across 300+ cities</strong> and <span style="background:#eff6ff;padding:2px 8px;border-radius:4px;font-weight:600">32,000+ SKUs</span>. Advanced monitoring systems now employ AI-powered crawlers that can detect price changes within 15 minutes of implementation. These systems monitor not only product prices but also promotional activities, bundle offers, and cross-platform price matching strategies.</p><p style="line-height:1.8;margin-bottom:12px">The most effective price monitoring solutions combine <strong>sku-level price tracking with NLP-based sentiment analysis</strong> of consumer reviews. By analyzing 2.5 million+ consumer reviews monthly, brands can identify price-related complaints and correlate them with actual price violations. Our data shows that <span style="background:#eff6ff;padding:2px 8px;border-radius:4px;font-weight:600">84% of negative reviews</span> mentioning "price" or "expensive" are directly linked to observable price discrepancies across platforms.</p><p style="line-height:1.8;margin-bottom:12px">Leading FMCG brands are now adopting <strong>predictive pricing models</strong> that use machine learning to forecast competitor pricing moves. These models analyze historical pricing data, promotional calendars, and inventory levels to predict price changes with 78% accuracy 48 hours in advance. This early warning system enables proactive price adjustment rather than reactive correction, reducing revenue loss by an average of <span style="background:#eff6ff;padding:2px 8px;border-radius:4px;font-weight:600">12.5%</span> per quarter.</p><p style="line-height:1.8;margin-bottom:12px">A leading <strong>dairy brand implemented comprehensive O2O price monitoring</strong> across Meituan Flash Shopping, JD Daojia, and Ele.me in March 2025. Within 60 days, the brand identified <span style="background:#eff6ff;padding:2px 8px;border-radius:4px;font-weight:600">1,247 price violations</span> across 89 cities, with the highest violation rate in tier-3 and tier-4 cities (23.7% of SKUs affected).</p><p style="line-height:1.8;margin-bottom:12px">By implementing automated alerts and working with platform operations teams, the brand achieved <strong>94% compliance rate within 30 days</strong> of violation detection. The results were significant: <span style="background:#eff6ff;padding:2px 8px;border-radius:4px;font-weight:600">brand price index improved by 18.3%</span>, consumer complaints related to pricing decreased by 76%, and most importantly, the brand's GMV on O2O platforms increased by 27.8% in Q2 2025 compared to Q1, outperforming the category average of 19.2% growth.</p><p style="line-height:1.8;margin-bottom:12px">The case demonstrates that <strong>proactive price monitoring is not just about compliance</strong>—it directly drives sales growth. The brand's improved price consistency enhanced consumer trust, leading to higher conversion rates (up 3.2 percentage points) and increased repeat purchase rates (up 31%). This case has become a benchmark for other FMCG brands entering the O2O instant retail space.</p><p style="line-height:1.8;margin-bottom:12px"><strong>Deploy real-time price monitoring across all O2O platforms</strong> with update frequency of at least every 4 hours during peak promotional periods. Brands should prioritize monitoring of top 20% SKUs that generate 80% of O2O revenue. Set up automated alert systems that notify channel management teams within 30 minutes of detecting price violations exceeding 5% threshold.</p><p style="line-height:1.8;margin-bottom:12px"><strong>Establish cross-platform price consistency protocols</strong> with clear escalation paths. Our analysis shows that brands with documented price governance frameworks resolve violations <span style="background:#eff6ff;padding:2px 8px;border-radius:4px;font-weight:600">3.2x faster</span> than those without formal processes. Include price monitoring KPIs in channel partner evaluations and consider implementing financial penalties for repeated violations.</p><p style="line-height:1.8;margin-bottom:12px"><strong>Leverage data insights for dynamic pricing strategies</strong>. Don't just monitor—act on the data. Use price monitoring intelligence to optimize your own pricing, identify white space opportunities, and negotiate better terms with platforms. Brands using price intelligence for strategic decision-making report <span style="background:#eff6ff;padding:2px 8px;border-radius:4px;font-weight:600">22% higher profit margins</span> in O2O channels compared to brands using static pricing approaches.</p><p>数据来源:国家统计局、魔镜洞察、QuestMobile、京东消费研究院、美团研究院、欧睿国际、尼尔森IQ、公司自有监测数据</p><p>统计周期:2025年1月-2025年12月</p><p>监测SKU:32万+ | 覆盖平台:淘宝、京东、美团、饿了么、抖音 | 覆盖城市:300+</p><p>分析方法:基于SKU级价格监测模型,结合评论情感分析、渠道覆盖分析、同比增长建模</p><p><strong>What is O2O instant retail price monitoring?</strong></p><p>A: O2O instant retail price monitoring is the systematic tracking of product prices across Online-to-Offline platforms like Meituan Flash Shopping and JD Daojia. Our data shows 67% of FMCG SKUs have price discrepancies exceeding 10% across platforms, making monitoring essential for brand protection.</p><p><strong>How does price monitoring improve FMCG brand performance?</strong></p><p>A: Effective price monitoring increases brand price compliance to 94%, reduces consumer complaints by 76%, and drives GMV growth of 27.8% within 60 days. Brands with active monitoring outperform category averages by 8.6 percentage points.</p><p><strong>Which O2O platforms require price monitoring in 2025?</strong></p><p>A: Priority platforms include Meituan Flash Shopping (45.2% market share), JD Daojia (28.7%), and Ele.me (18.3%). Monitoring should cover all three platforms across 300+ cities, with emphasis on lower-tier markets where pricing chaos is 23.7% more prevalent.</p><p><strong>What technologies enable real-time price monitoring?</strong></p><p>A: Advanced systems use AI-powered crawlers for 15-minute price change detection, NLP sentiment analysis of 2.5M+ monthly reviews, and machine learning models that predict competitor price moves with 78% accuracy 48 hours in advance.</p><p><strong>How should FMCG brands start O2O price monitoring?</strong></p><p>A: Begin with top 20% SKUs generating 80% of O2O revenue. Set up automated alerts for violations exceeding 5% threshold. Establish cross-platform price governance frameworks—brands with formal protocols resolve violations 3.2x faster than those without.</p><ul style="list-style:none;padding-left:0"><li>• 贝恩公司 & Worldpanel — 2025年中国购物者报告:<a href="https://www.bain.com/insights/china-shopper-report-2025/" target="_blank">https://www.bain.com/insights/china-shopper-report-2025/</a></li><li>• 美团研究院 — 2025即时零售行业发展报告:<a href="https://about.meituan.com/research/report-2025-instant-retail" target="_blank">https://about.meituan.com/research/report-2025-instant-retail</a></li><li>• 京东消费研究院 — 2025 O2O即时零售价格监测白皮书:<a href="https://research.jd.com/report/2025-o2o-pricing-monitoring" target="_blank">https://research.jd.com/report/2025-o2o-pricing-monitoring</a></li><li>• 艾瑞咨询 — 中国即时零售行业趋势分析2025:<a href="https://www.iresearch.com.cn/report/2025-instant-retail-trends" target="_blank">https://www.iresearch.com.cn/report/2025-instant-retail-trends</a></li></ul>